Recording with over-dubbed anime voices from inside a giant robot fighting balloons at the Macy’s Thanksgiving Day Parade aka the hardest working man in Business#show aka the textbook-a-day diet center aka the dystopian future think tank aka the final destination coincidence log aka the church of real-life CRUD aka the Flatiron School last man standing.
According to research published by Google and Bing in 2009, even server delays of less that half a second affect user engagement. Of particular interest was Bing’s finding that their revenue per user decreased by almost 3% with a server delay of 1 second.
Not to mention the fact that since 2010 Google uses load time as a factor in page rankings.
According to Ilya Grigorik from Google’s GoFast team “fast” means under 250ms. He calls that the magic number. Meanwhile the median load time for a page on desktop is 2.7s and the mean is 6.9s. While you are waiting for your page to load go watch Ilya’s talk on web-performance: http://www.igvita.com/2013/01/15/faster-websites-crash-course-on-web-performance/.
So what should you do to make your site faster? How much can even do? Unless you sit on the board of Comcast or AT&T much of the life cycle of an HTTP Request is actually out of your control.
An HTTP Request goes through four main phases. The first phase is the DNS lookup. It will take approximately 130ms to get the client’s browser pointed at your server. There’s not much you can do about that. The second phase of an HTTP Request is the handshake. The client’s browser will open a TCP connection with the server so that data can start flowing. This handshake requires a round-trip from the client’s browser to your server and back again. So the timing depends on how far apart the client and your server are. The only thing you can really do to make this faster is to use a CDN (content delivery network). With a CDN your content will be stored on servers all around the world. This means the HTTP Request will, on average, have less globetrotting to do. Now that a connection is open with the client’s browser your server can finally process the HTTP Request. The server responds with assets from the database and arranges them in the body of an HTTP Response. During the fourth and final phase the client’s browser has to download all of this content from the server and paint the page.
The last two phases are where you can really improve performance with good design and the right analytic tools. The server response and the content download represent the back-end and the front-end, respectively. They do not, however, have equal impact on the total page load time. According to Steve Souders:
“80-90% of the end-user response time is spent on the frontend. Start there.”
My favorite tools for analyzing front-end performance are Google Analytics and the PageSpeed Chrome extension. Google Analytics mostly tracks visitor behavior and PageSpeed mostly makes suggestions on how to streamline your assets.
When I used PageSpeed on a js-heavy, graphics-heavy site I built I received these suggestions:
Serve scaled images – I am using the same images for thumbnails (scaled in css) as I am for their full-size twins. According to PageSpeed by serving seperate thumbnails that are properly sized I could save 2.2MB. I ran PageSpeed on NYtimes.com and found that they had the same problem.
Enable Compression – I am not using gzip for two of my js files. According to PageSpeed I could be saving 285KB.
Optimize Images – Two of my images aren’t compressed. I could save 38KB by compressing them.
Minify Javascript – I have one unminified javascript file. Minifying this file would save me a slight 513B.
Leverage Browser Caching – By setting an expiration date on static assets I could tell the client’s browser to load those assets from the local disk instead of needlessly refreshing them over the network. More on this later.
Defer Parsing of JavaScript – JavaScript blocks other assets from being loaded because the js might change those assets with something like document.write. Browsers don’t want that mess so if they find javascript they wait until after the javascript has been run to load the next file in line. This is why js should go after everything right before the closing body tag.
Enable Keep-Alive – Keep-Alive maintains the same TCP connection for multiple HTTP Requests. The tricky thing with TCP connections is that they have a slow-start feature to probe how much data the network can handle in a single segment. Keep-Alive allows your TCP connection to continue sending the largest possible segments. While most of my header do have it enabled, Faye seems to default to disabling Keep-Alive.
I used Rails for the above project. Rails handles much of the front-end optimization automatically with the asset pipeline and with Rack middleware. The asset pipeline will concatenate all your css and js files so that you need less HTTP Requests to serve all your assets. For the issues that have to do with caching Rack::Cache and Rack::ETag are there to help. By default Rack should set the cache-control to public (so it can be stored locally) and provide a max-age. Rack::ETag should provide a fingerprint so that while the assets are still fresh they are not requested from the server again. That means more “304 Not Modified 2ms” and less “200 OK 100ms”. It seems like for some of my headers Rack decided to do things differently. If I wanted to over-ride Rack’s header defaults I could. For example, to set “Cache-Control max-age=180, public” I could add “expires_in 3.minutes, :public => true” to the relevant controller.
Don’t rely on tools like PageSpeed to fix your front-end after you build it. Better to, as you go, remember to use the right size/format images, concatenate css and js, put css first and js last, and set your headers to cache static assets. Once you do all that it is time to think about the back-end.
For analyzing server performance New_Relic can tell you everything you want to know. It’s better than looking through log files.
While working on a project that used Github’s API I had a page to display all the repos for a particular user. When the page took 7s to load I started looking through the server logs. It was immediately obvious which database query was responsible. Knowing that, I was able to track down the bug in my code. The bug turned out to be a check across all the user’s repos that was happening every time the user page loaded instead of just once when pulling in the Github API. By taking out this check I was able to load the repos in 12ms instead of 7s.
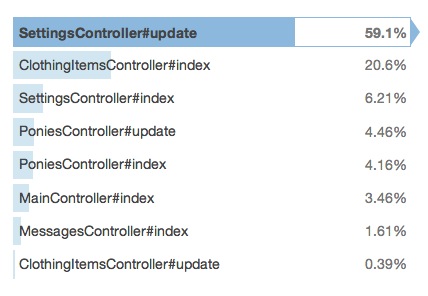
But what about when the problem is less obvious? My previous example is an easy case. If you are trying to tune your site’s performance you probably don’t want to be sifting through server logs. New_Relic will show you a break-down of every web transaction and which controller actions are involved.
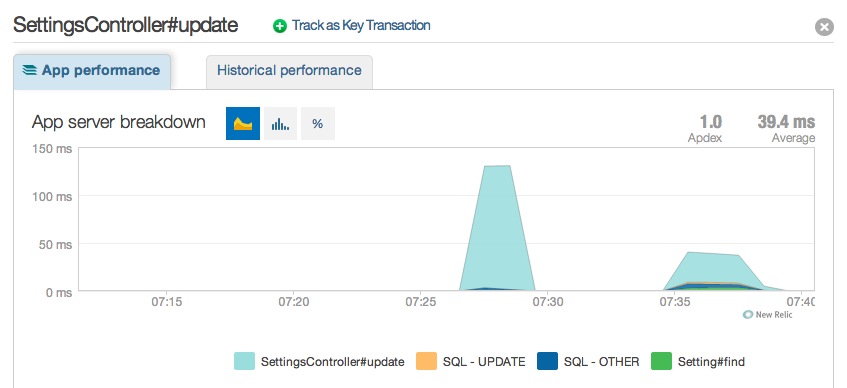
Using New_Relic I was able to identify a slow controller action.
I realized I had foreign keys that should be indexed but weren’t. After indexing I saw my server response time go from 125 ms to under 50ms. Just like that.
Now that I have my front-end and my back-end taken care of, if anything is slow I can blame it on the speed of light.